World Population: 2020 Overview
World Population: 2020 Overview

NEW YORK: Governments, businesses and investors find regular demographic reviews of the world population to be useful as considerable variations exist across regions – rich and poor, young and old, good health care or not, secure climates or not – that create enormous push-pull forces behind increased international migration flows. An understanding of world population levels, trends and projections constitutes an essential ingredient in strategic planning, policy development and program implementation for addressing global challenges and emerging issues.

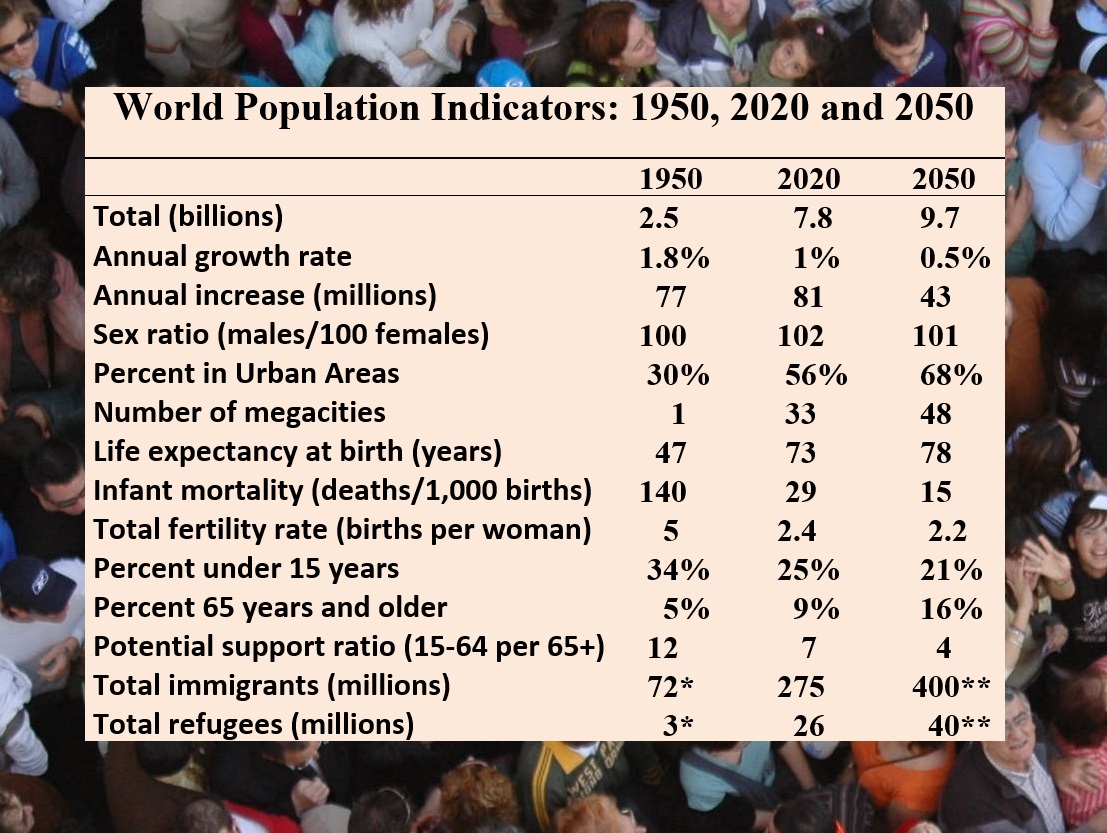
The world population now stands at 7.8 billion inhabitants, having reached the 7 billion milestone in 2011. Demographers expect the 8 billion milestone in 2023, with global population projected to reach 9 billion by 2037 and 10 billion by 2056. This growth is slightly faster than projections from just a few years ago.
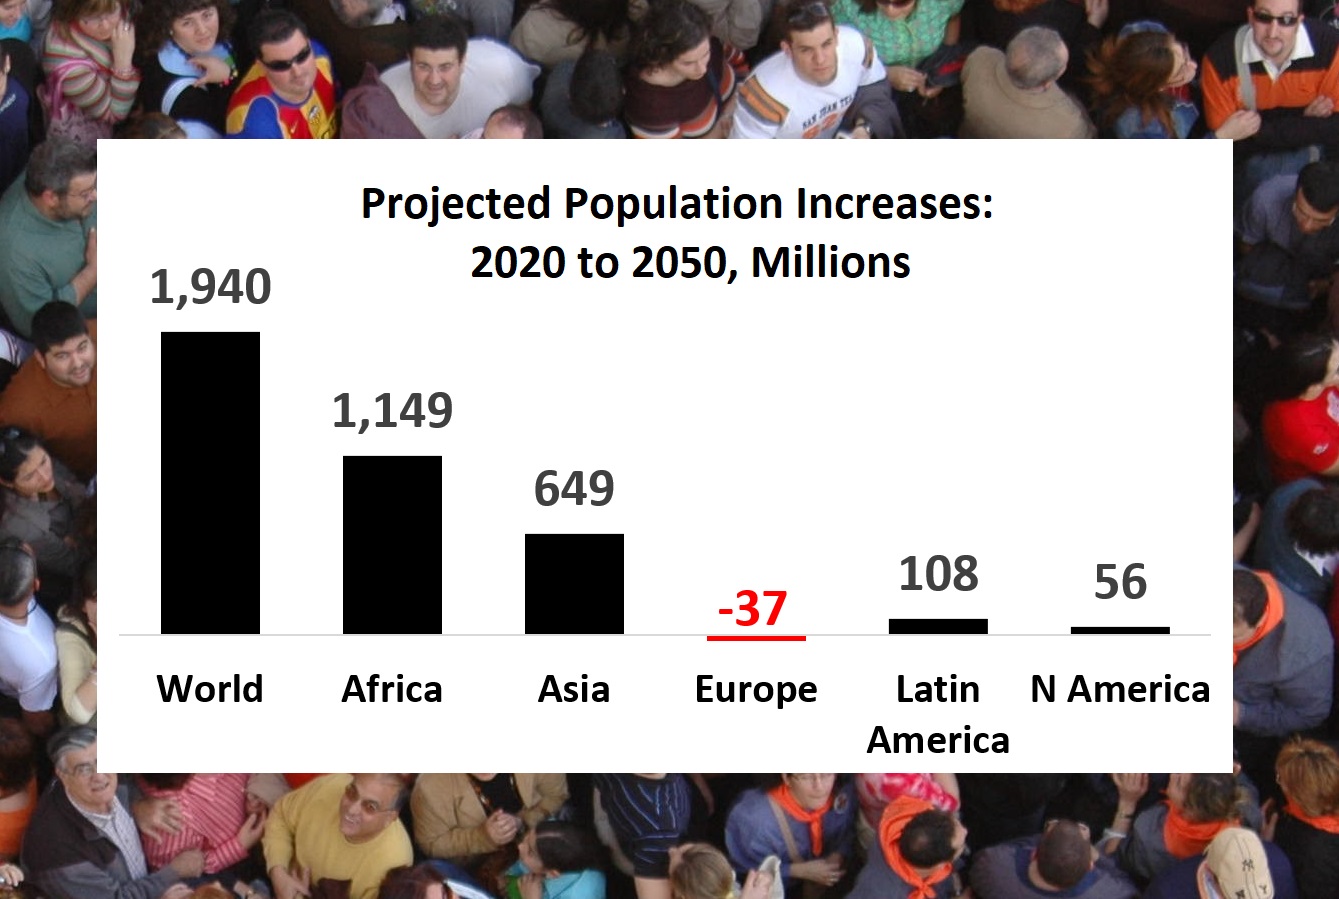
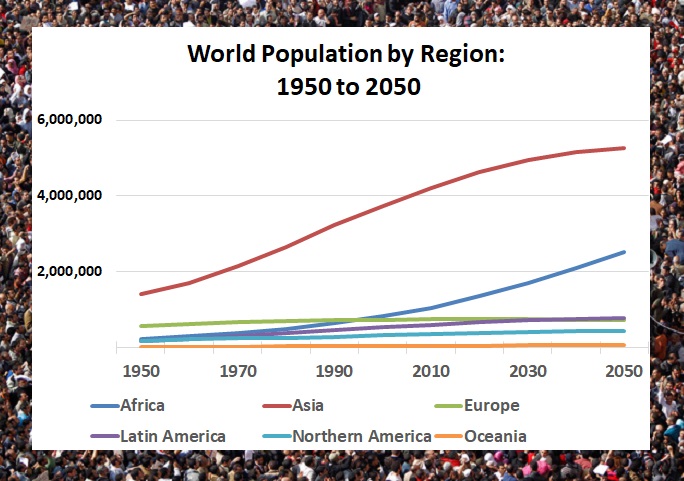
World population currently grows at 1 percent annually, having peaked at 2.1 percent in 1968. That annual growth rate is expected to continue declining, reaching 0.5 percent by midcentury. The current annual increase of world population is 81 million, lower than the peak level of 93 million in 1988. Annual additions are projected to continue declining, reaching 48 million by 2050. Of the nearly 2 billion increase in world population expected by midcentury, most will take place in less developed regions. Africa leads, expected to add more than 1 billion people over the coming three decades, followed by Asia with about 650 million. Europe’s population, in contrast, is projected to decrease by 37 million over this period.
Two countries have reached the billion mark: China and India, each with current populations of 1.4 billion, reached that milestone in 1980 and 1997, respectively. India’s current rate of demographic growth is double China’s, 1.0 versus 0.5 percent. India’s population could overtake China’s by 2027. No other country is expected to reach a billion during the 21st century. Nigeria, projected to grow to 733 million by century’s close, will move into third place by midcentury, overtaking the United States, anticipated to have 434 million people by 2100.
The population growth is extraordinary, with most occurring in the world’s poorer countries. More than 50 developing countries, most in Africa, post growth rates no less than 2 percent per annum. By midcentury about half of those countries are projected to see their populations more than double, including Angola, Burkina Faso, Democratic Republic of Congo, Mozambique, Niger, Nigeria, Tanzania and Uganda.
At the same time, some 20 countries, particularly more developed countries, navigate uncharted demographic territory of population decline and rapid aging. These include Greece, Hungary, Italy, Japan, Poland and Spain. This number could nearly triple by midcentury, and expected newcomers to population decline will soon include China, Germany, Russia and South Korea.

The world population’s sex composition has been relatively balanced and stable over the past 70 years, with a ratio of around 100 to 102 males for every 100 females. Notable exceptions to that general pattern are China and India, whose population sex ratios are above 105, largely due to sex-selective abortions of female fetuses. Sex ratios at birth of most countries are around 105 males per 100 females, yet the ratios have reached as high as 120 in China and 114 in India in recent years. Recent data suggest these ratios appear to be on the decline.
Throughout human history, most of the world’s population lived in rural areas. A decade ago, the situation flipped with urban dwellers becoming the majority of the world’s population. The proportion residing in urban areas has increased to 56 percent today and is expected to continue rising to nearly 70 percent by midcentury.
Coupled with world population’s urban shift is the marked increase in the number of megacities with populations of 10 million or more. While New York was the only megacity in 1950, the world has 33 megacities today, a number expected to rise to 43 within a decade. Some of the most rapid population growth of megacities in recent decades happened in Africa and Asia. Since 1990, the populations of no less than 10 megacities, including Delhi, Shanghai, Dhaka, Lahore and Lagos, have tripled in size
A welcomed demographic change is increased longevity. Over the past seven decades, life expectancy at birth for the world increased by 28 years, from 45 to 73, and reached highs in excess of 80 years in most developed countries with growing numbers of centenarians. Impressive declines in infant mortality since 1950 have led to the world’s infant mortality rate falling by 80 percent, from 140 to 29 deaths per 1,000 live births. These trends are expected to continue throughout the 21st century. The world population’s life expectancy at birth is projected to reach 77 years in 2050 and nearly 82 in by 2100.
Another welcome change: decline in fertility rates. With women and men gaining control over the desired number, spacing and timing of their children, global fertility has decreased significantly from an average of about five births per woman in 1950 to 2.5 births per woman today. The global fertility rate, now at 2.4 births per woman, is expected to reach the replacement level of approximately two births by 2050. The number of countries experiencing fertility rates below the replacement level, currently at a record high of 83 or about half of the world’s population, is expected to increase to 130 by midcentury, representing nearly two-thirds of world population.

As a result of low fertility and increased longevity, population aging has become a challenging issue in the 21st century. Before 1995, no country had experienced the historic reversal – with the elderly aged 65 years and older outnumbering children under age 15. Italy was the first in 1995, and now 34 developed countries live with this trend.
The historic reversal will continue in virtually every country, covering 90 countries by midcentury, and the world as a whole can expect the epochal transition in 2075.
A consequence of population aging is the decline in the ratio of the working age population to the elderly population. The world’s potential support ratio – or PSR, the total working-age population, aged 15 to 64 years, to those aged 65 years or older – has declined from 12 in 1950 to seven today. The decline in such support is continuing, expected to sink to four by midcentury. Among the more developed countries, PSR has fallen to comparatively low levels. The ratio for more developed regions has declined from about eight in 1950 to slightly more than three today. For some countries, such as Germany, Italy and Japan, the PSR has fallen below three and is expected to fall below two by 2050.
International migration has increased in recent years, with about 275 million people, or slightly more than 3 percent of the world’s population, residing outside the country of their birth. In addition, war, violence and persecution drove the forced displacement of people worldwide to another new high of 71 million at the end of 2018. Among them were 41 million internally displaced persons, 26 million refugees and 4 million asylum seekers.
Future international migration flows will continue, including the exodus of humanity’s desperate, taking place despite walls, barriers, guards, patrol ships and nativist political rhetoric. Governments of origin, transit and destination countries struggle with how best to cope with unauthorized migration flows.
Demographic trends, particularly population growth, decline, aging, urbanization and international migration, are contributing to the many challenges facing humanity, including food production, water shortages, poverty, housing, climate change, environmental degradation, human rights, civil unrest, displacement and armed conflict. Anticipating the consequences of those powerful demographic megatrends could stave off security and economic crises.
Joseph Chamie, a former director of the United Nations Population Division, is currently an independent consulting demographer.
Comments
I believe there is some serious mistake when Joseph says there was a peak level of 93 million in 1988 and now we are arround 81 million and descending. According to World Data Bank numbers, there would be a clear trend to keep gaining growth every year. I made a graph from the year 2000 until 2018 and the trend is clearly going upwards. I beg you to revise.
The figure refers to growth added each year and not the total population.
https://population.un.org/wpp/Publications/Files/WPP2019_Highlights.pdf
But Rodrigo was referring to the number added each year, which has indeed been going up since 2000 (after a brief period of decline in the 1990s). It is difficult to know what the number is recently, because each UN update revises the past as well as the present, tending to attribute the greater-than-anticipated population for this year to higher-than-previously-thought estimates in past years rather than to a bigger increment in the current year. And Population Reference Bureau have stopped including the annual increment in their yearly World Population Datasheet. But if you look at PRB's estimate of the current population, year on year, it's been going up by more than 90 million in recent years. https://overpopulation-project.com/world-population-prospects-2019-good-...
For the life of me, with the pollution levels, rapidly melting ice and permafrost, extreme temperatures and fires, dreadful loss of bio-diversity and vast distress already prevailing, I don't understand that every single country and every single institution in the world are not saying, the single most urgent target is to stabilise our numbers at the already grotesque figure of 7.8 billion to give the biosphere some breathing space, and let them decline. As the single daughter of a single mother I have no children and I resent my father who was a physicist specialised in thermo-dynamics having made me a part of this mess. The Human species is absolutely demented if you ask me.
Yet again, the increase in population is reported without any indication whether it is a good or bad thing (other than noting that fertility decline is "welcome" - without noting that it's declining slower than expected), with no attempt to link it to the "war, violence and persecution" driving forced migrations. Meanwhile aging is presented as a challenge, with emphasis on the "support ratio", a statistic that grossly misrepresents the impact on workforce and demand for aged care or health care. In the real world, aging has not reduced employment, it has only reduced unemployment and exploitative work that are features of oversupplied labour markets. On the cost side, the elderly are getting healthier, retiring and needing aged care later. But all the hoo-ha is causing countries like Iran, Tanzania and Turkey to withdraw women's access to contraception for fear of aging. It would be good if population growth came with a mention of arable land per capita, as often as aging comes with warnings about support ratios. Underutilised land is much scarcer than underutilised labour these days!
I am thrilled to find a secondary source for population and demographic data that reports the measurements and calculations without telling me what to think about them. Please continue to do that, no matter how many natterers are incensed about it, thank you.
Good work Joseph, please keep it up and bring more secondary data & insight about the world demographic within your context of delivery. The article has allowed readers to freely form theirs opinion and express them clearly. This is what it should be.
US Census Bureau estimate 7.577 million June 2019
Worldometer current population 7,791 million June 2020
214 million increase in 1 year, 2.74% increase
almost 3 times your figures, something is very off the mark?